VPD Chart: Advanced VPD Calculation Tool
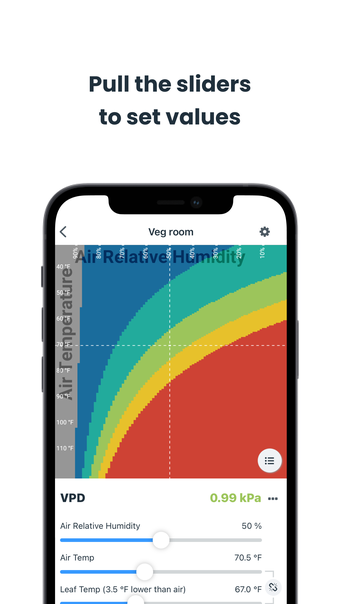
VPD Chart is a utility application designed for iPhone users, focused on calculating Vapor Pressure Deficit (VPD) using air temperature, relative humidity (RH), and canopy temperature. The app allows users to generate detailed charts that display VPD values, facilitating a better understanding of environmental conditions for various crops such as cannabis, tomatoes, leafy greens, and cucumbers. Users can choose to connect sensors for automated readings or manually input data via intuitive sliders and text fields.
Top Recommended Alternative
Key features of VPD Chart include the ability to define an unlimited number of charts and organize growing areas by assigning specific charts to different zones. The app also supports various Bluetooth devices for seamless sensor integration, offers educational benefits through interactive learning, and includes features like dark mode and dew point area visualization. Users can manipulate input sliders to explore VPD dynamics and visualize the relationship between canopy and air temperatures effectively.